Why is soil conductivity mapping so important to farmers?
The factors that drive Soil EC also drive Soil Productivity
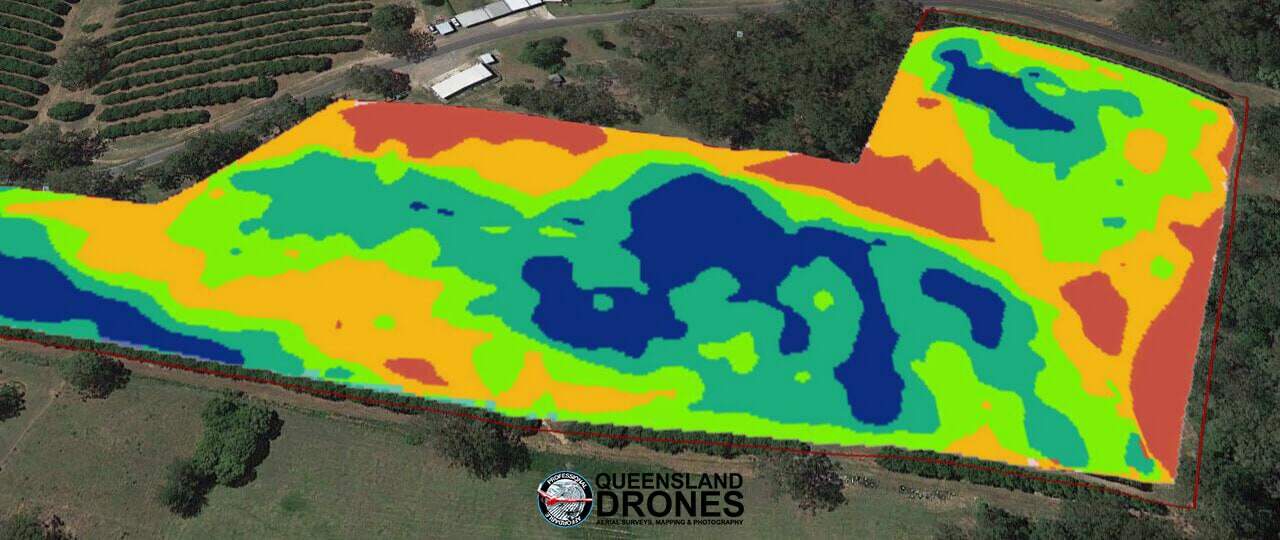
Soil conductivity testing and mapping is a proven technology that’s been around for decades. Farmers and growers, crop consultants, nutrient suppliers, agronomists and soil scientists around the world use EM/EC soil testing and soil conductivity mapping in conjunction with physical soil testing and vegetation analysis to manage how they choose which areas will produce the best outcomes for a particular crop, how much seed to sow in each specific area according to the soil type characteristics, how much water to give the crop and what nutrients the soil will need to achieve the best crop outcomes.
Most growers have had the experience where you apply the same amounts of seed, the same level of fertiliser, the same amounts of water and the same pesticides across a large field, but at the end of the crop you see different yields. This is related at least in some part to soil texture, nutrient holding capacity, salinity and water holding capacity. These are the factors we measure using EM soil mapping.
It’s not rocket science. We all know that soil quality affects how plants grow, how much additional nutrition they need and how much water they need to grow. This is, however, verifiable science and the results are clear to see. We have observed again and again that the zones identified through EM soil conductivity mapping will often be reflected in NDVI crop health mapping, biomass mapping (where appropriate) and harvest yield mapping.
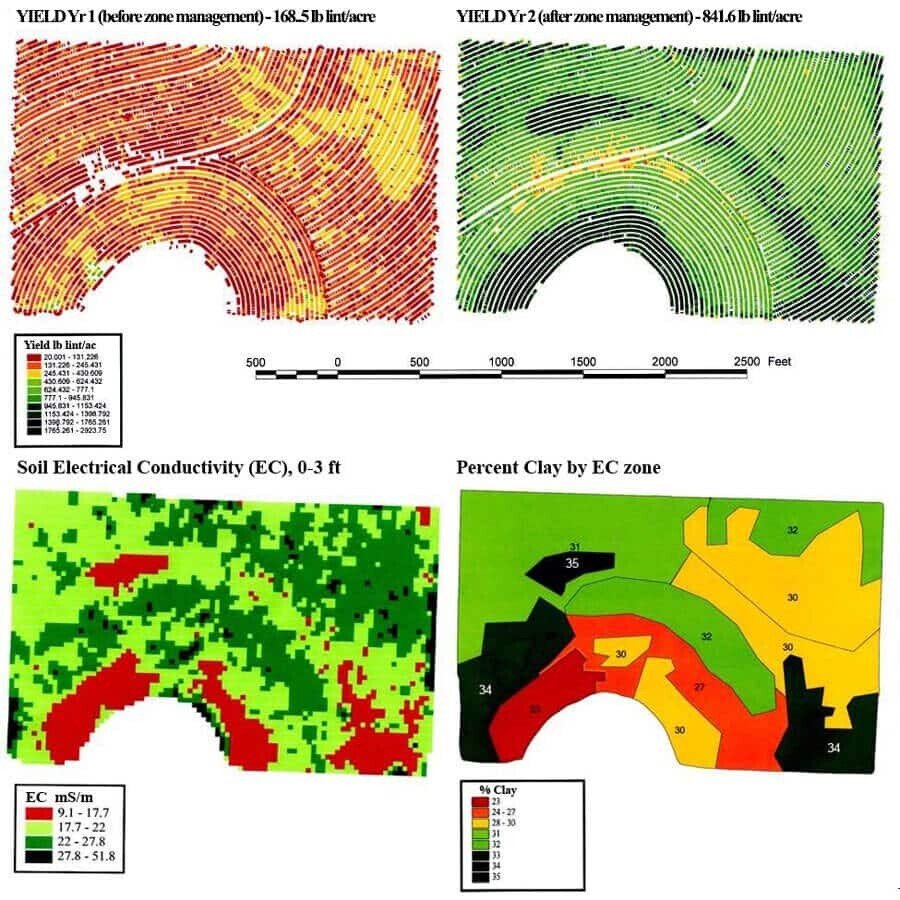
The following example, in cotton farming, shows how soil texture impacts yield and how zone management based on knowledge of soil texture can dramatically improve harvest yield.
What is surprising is that not every farmer is yet using this extremely valuable and reliable source of soil management data. One of the reasons for this, perhaps, is that EM soil conductivity mapping has not always been well executed. On it’s own, EM data is interesting but not reliable. Like any precision agriculture data, it requires ground-truthing before it becomes a useful source for creation of soil management zones.
EM soil conductivity testing is a method to estimate soil textures across a field or farm – ie, how much sand, silt or clay is in each area of the field or farm, which acts as an indicator of how much moisture the soil is holding, at two specific depths – usually at the sub-soil layer (about 0.5m below the surface) and at the deep root layer (1-1.5m below the surface). Clay particles in the soil will hold more moisture, so they conduct more electricity than the silt or sand particles. EM soil mapping measures how much moisture is being held in soil particles so we can estimate their clay, silt or sand content.
Soil texture and soil conductivity are important because they directly influence how plants will grow in that soil, and even put limitations on how much you can influence how they grow through nutrition, irrigation and fertilisation. Soil conductivity is a direct reflection on how well the soil holds moisture, which in itself informs how much water you can or should put into the soil during the growing season.
Soil type and soil texture are also critical indicators of the likelihood of soil erosion during storm weather events, and how well the soil will respond to addition of nitrogen or use of available nitrogen from previous crops. Soil texture is a strong indicator of how well the soil will hold, use or lose nutrients. Mobile nutrients like nitrogen pass quickly through light texture soils and are easily lost through nitrification in dense soil.

But for all that a map is just a map, data waiting for verification. Physical soil sampling and soil analysis testing is still required before we can be sure about the precise structure and characteristics of the soil, but the good news is that we only need one physical sample for each soil map zone, which saves a lot of time and money. Also, soil mappings are relatively constant unless large changes are made, so we recommend only mapping the soil once every five years or so.
How to use EM soil mapping as a decision-making tool
EM soil mapping is not just an interesting exercise in data collection, it’s the basis for a whole new way of managing soil variability as a key factor in crop yield.
For starters, you can use your soil mapping data to reduce the amount of physical soil sampling you need. What’s the point of sample multiple locations in the same zone, when the EC map is telling you these locations will have very similar soil texture and characteristics.
You can also use soil mapping data to better choice areas for seed trials, fertiliser trials and other crop tests. These are much more informative when they are conducted in areas that have the same or similar soil characteristics.
Soil mapping data can be used to define soil management zones to be used for variable rate seeding, variable rate fertiliser application and variable rate irrigation – even with sophisticated GPS-driven equipment.
You can also identify crop productivity zones based on soil type, percentage of organic matter and water holding capacity and test theories against actual yield data.
Queensland Drones can provide a complete EM soil mapping life cycle program, from initial soil type mapping using aerial data to ground-based EM soil conductivity data collection, to mapping zones of similar soil texture, to collection of physical samples from each zone, to basic Ph and salinity testing and even to full NATA laboratory analysis. Our soil analyst has more than 10 years experience in EM soil mapping, soil sampling and soil analysis.
What’s a drone operator doing providing EM soil mapping? It’s very simple – we’ve seen the results so many times now that we know our NDVI crop health mapping service is so much better when provided in conjunction with ground-based EM mapping that it was a no brainer that we had to integrate this product into our service offering. Of course it did help that our GIS specialist is also a soil analyst with lots of experience in EM soil conductivity mapping!
Where needed, we can provide variable rate nitrogen, variable rate irrigation and variable rate seeding maps for your GPS-controlled farm equipment. We can provide ongoing regular NDVI mapping of crops at various stage of growth to ensure that soil mitigation techniques are having the desired results. We can also take your harvest yield data and overlay it onto soil mapping and crop health mapping data to show how the inputs have matched up to the outputs from year to year.
Enquire about our EM Soil Conductivity Mapping service or Contact Us Now for an obligation-free discussion and quotation for your specific needs.


Leave a Reply
You must be logged in to post a comment.