Macadamia growers’ case study 2017
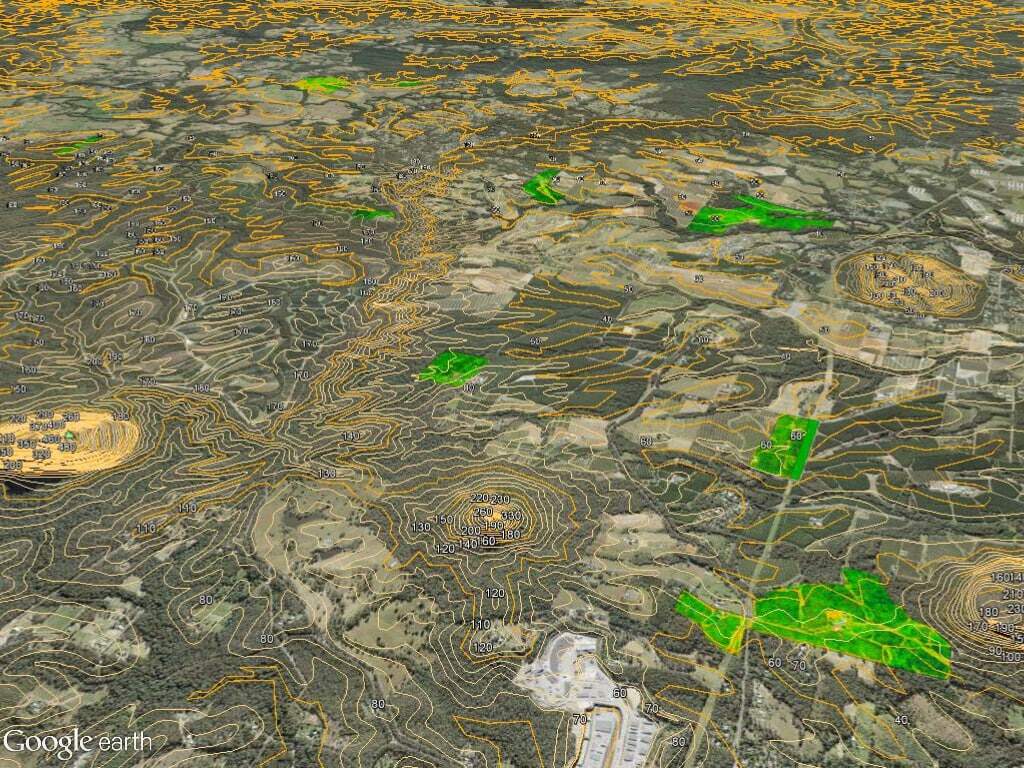
Queensland Drones is currently working with Growcom’s Hort360 project team to identify critical correlations between sub-soil conditions, soil drainage and erosion, and tree health in macadamia orchards on Queensland’s Sunshine Coast. So far we’ve worked with eight growers over a total of almost 500 acres of prime macadamia orchards across the hinterland region. There are still opportunities for other growers and growers in other regions to join this study.
The scope of the trials for macadamia growers is to compare EM38 sub-soil analysis with airborne LIDAR imagery and drone-based NDVI imagery to identify correlations at the sub-surface, surface and canopy levels which might point to endemic issues in the orchard, potential rectification projects and the current and future health of each three in the orchard before and after rectification projects.
For this case study we’re looking at a macadamia plantation in the eastern foothills of the D’Aguilar Range in the Sunshine Coast Hinterland. This area is part of the Nambour basin and is prone to erosion. The farm itself covers about 13 Ha and grows about 2100 trees covering 7 Ha of the block.
The case study images below use a slider to expose one layer over another layer. Each image starts with the slider in the centre. To see more of the featured layer, just move the slider ring to the right.
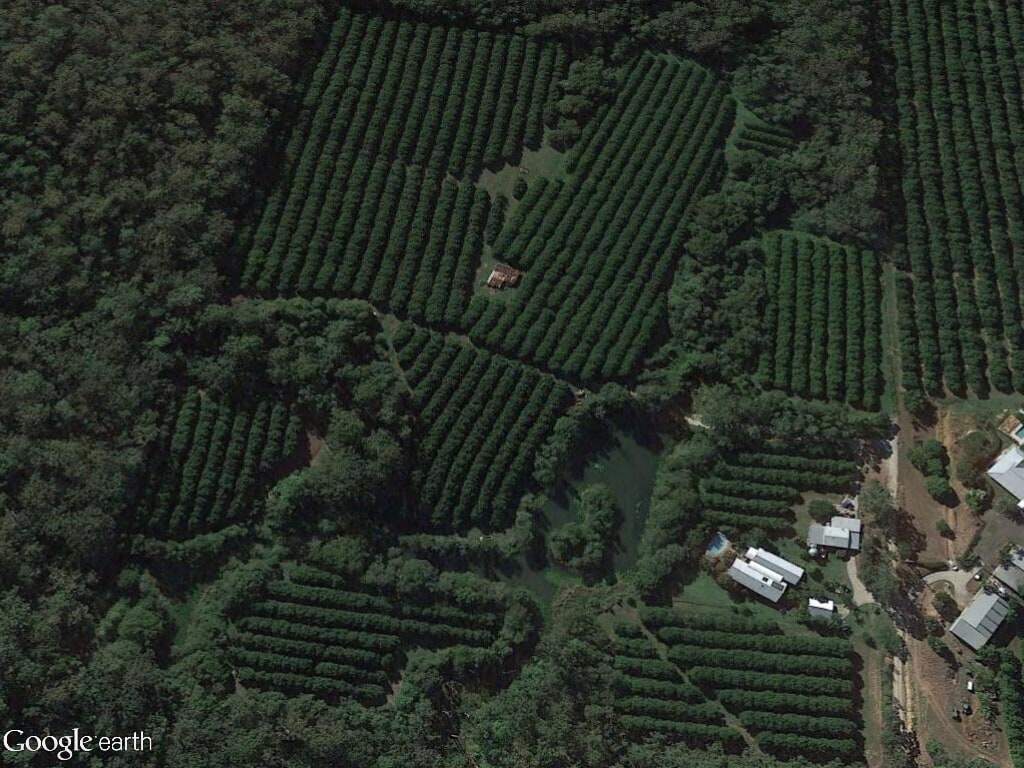
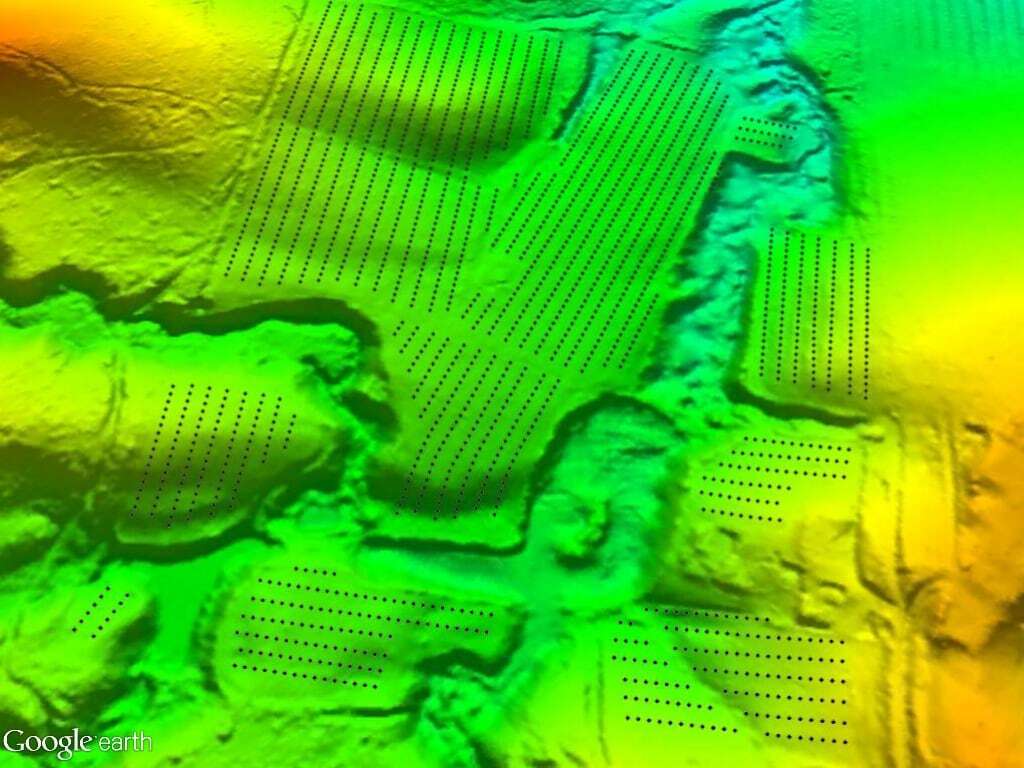
The case study plantation covers the base of a valley with a creek cutting through the lower right side and low hills around it. The orchard itself appears to be sites on an alluvial terrace.

The land on which the plantation is set has gentle to moderate slops with most of the plantations on slopes of less than 10 degrees.

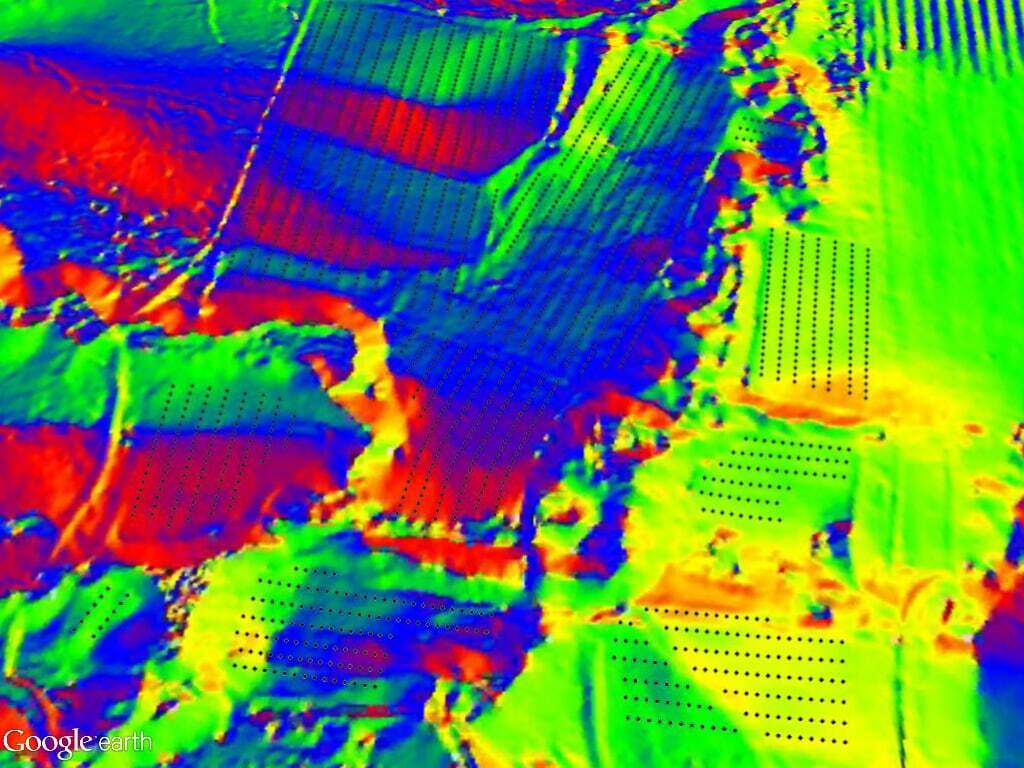
The blocks of macadamia trees are mostly planted on easterly and northerly facing slopes.

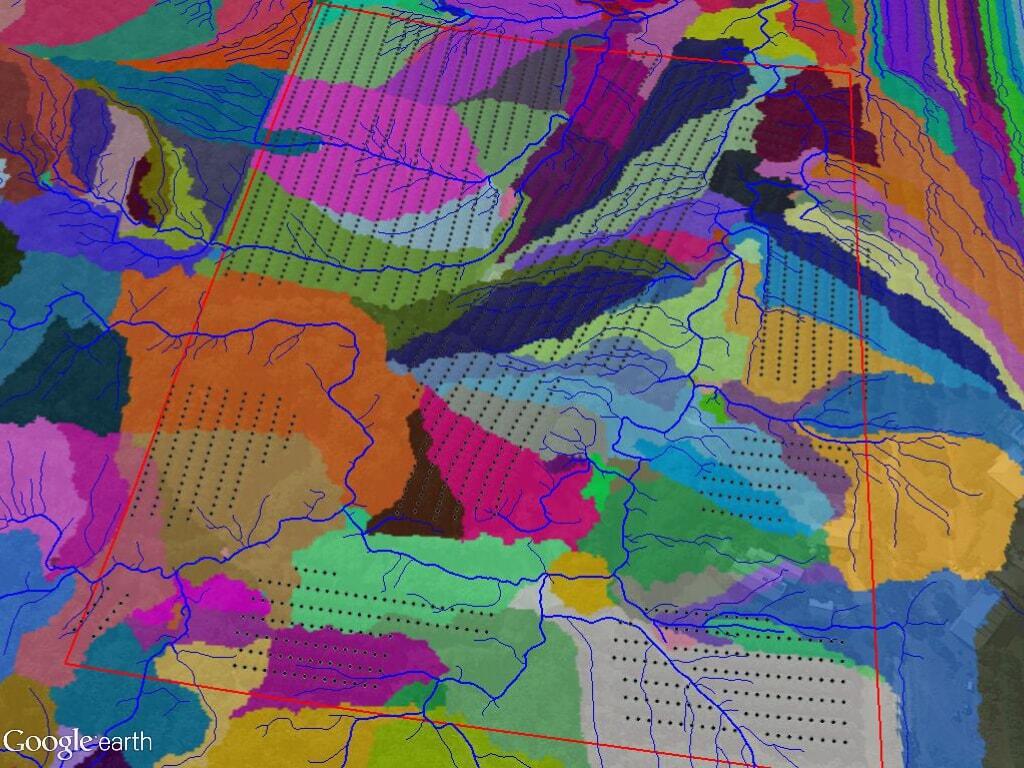
The drainage across the orchard is controlled by the gentle slopes and the natural water flow down to the incised creek which meanders through the property being fed by multiple gullies.
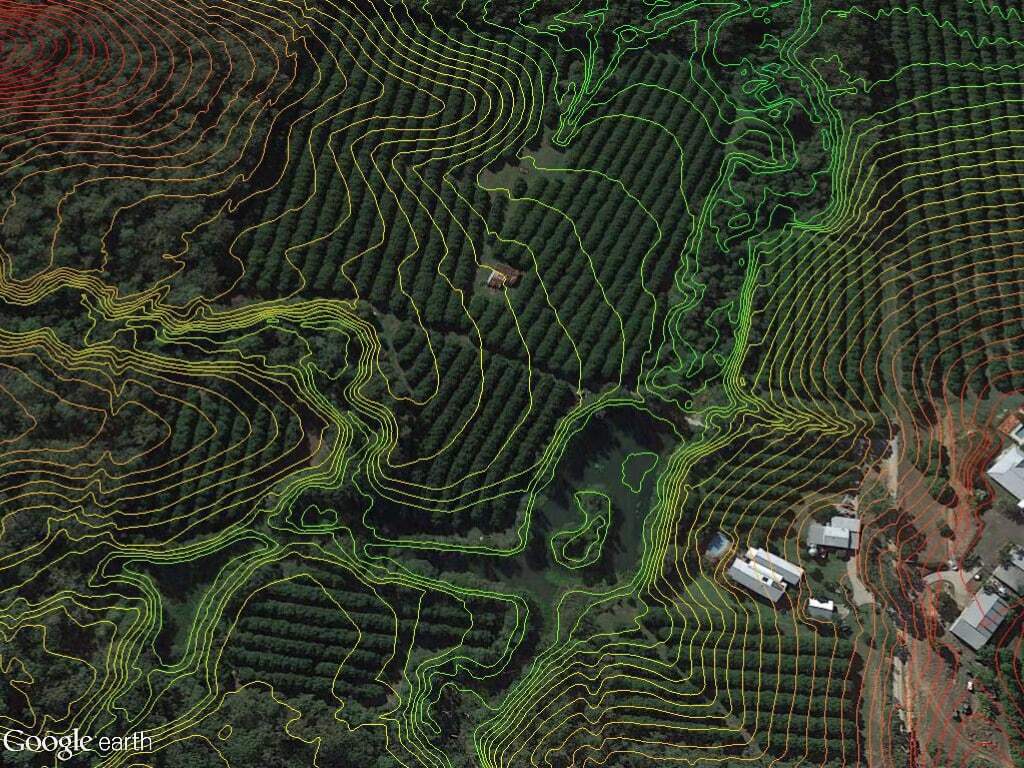

Water flows into the property from a number of neighbouring properties to the west, east and south, but most of the water that accumulates within the orchard comes from within the block itself.
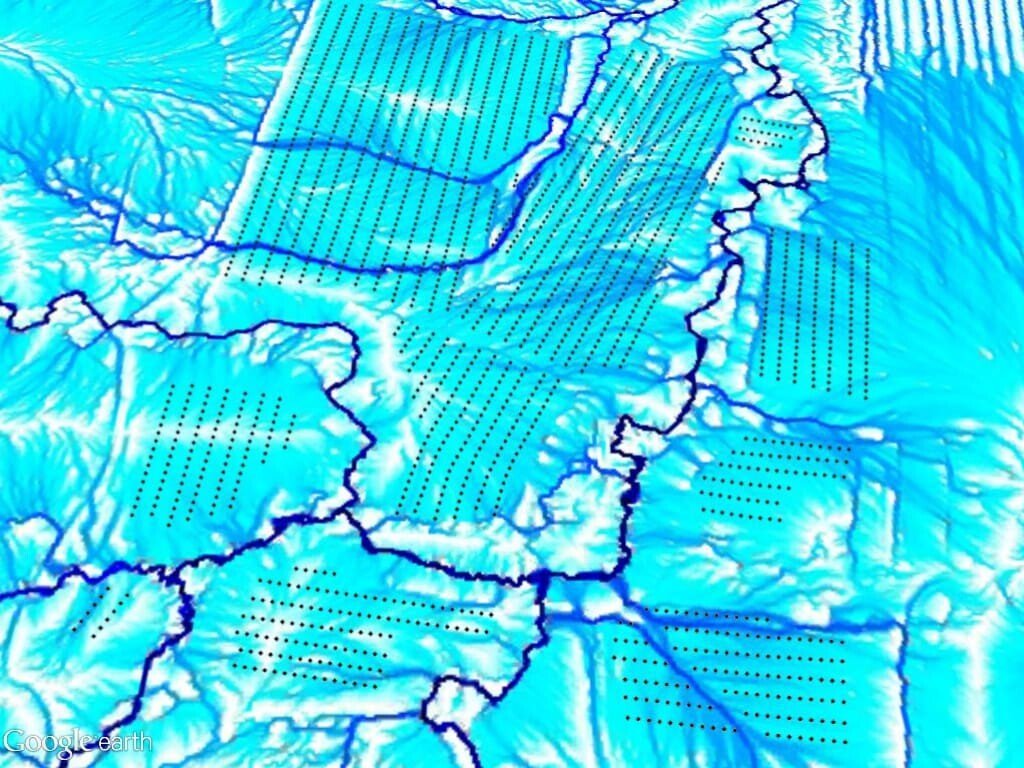

Water accumulates across the orchard through a number of main creek lines, some of which have been planted with macadamia trees.

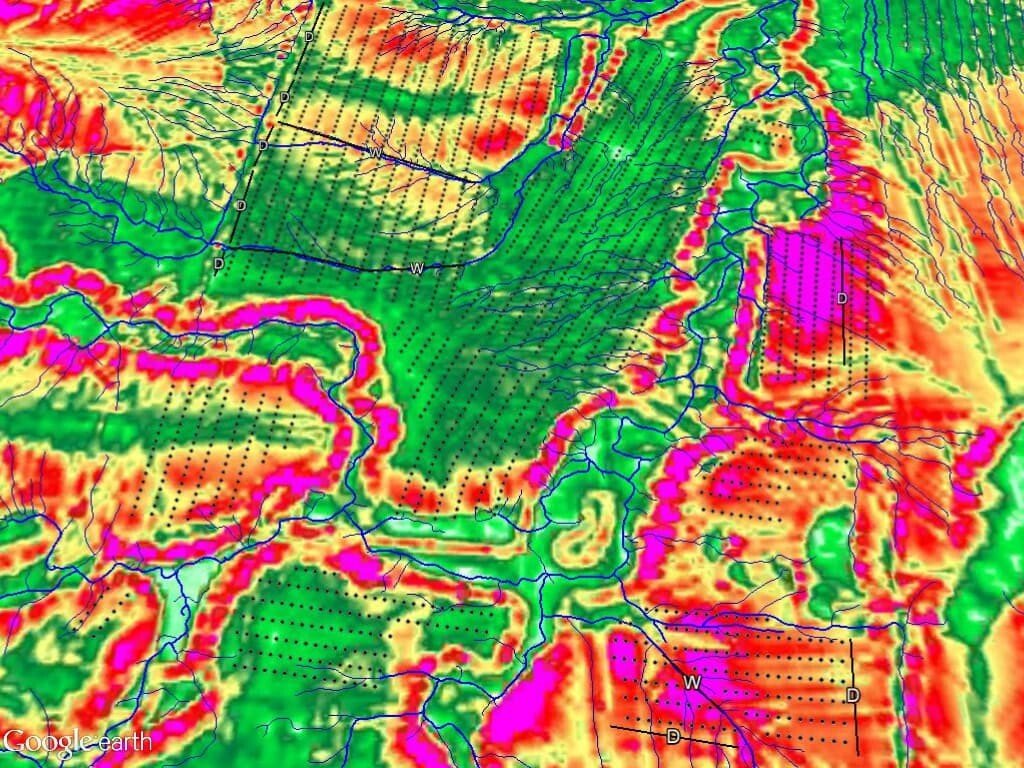
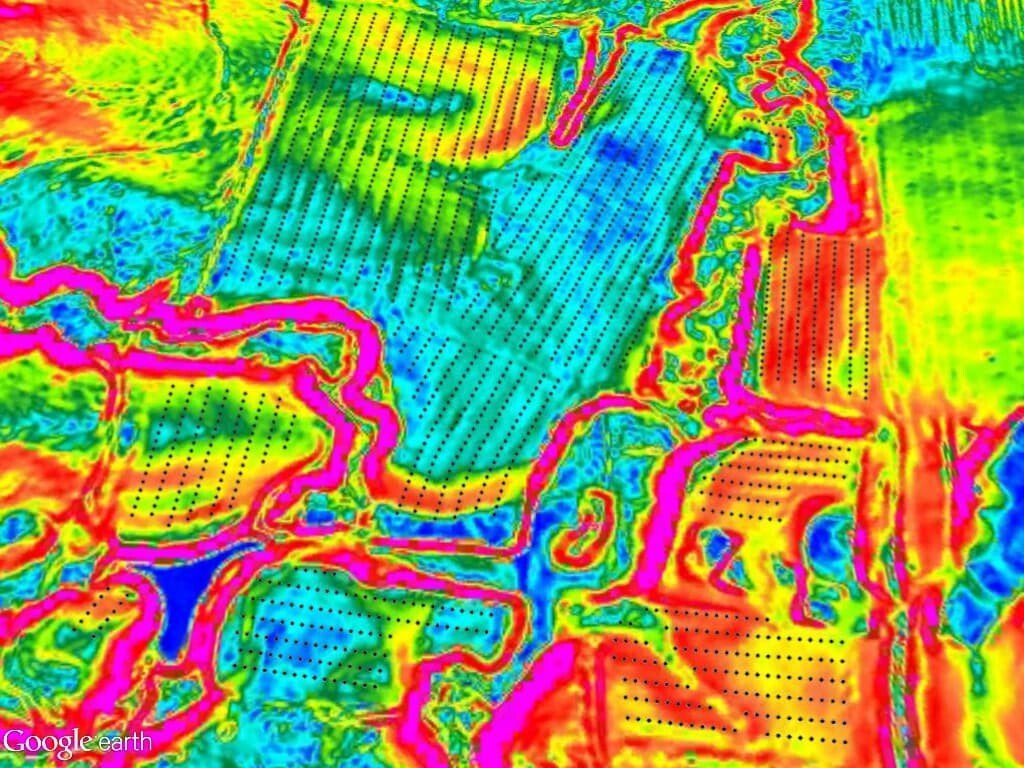
Erosion hotspots are identified using the LS factor (a component of RUSLE – the Revised Universal Soil Loss Equation) with the reddest areas showing the greatest potential for erosion due to the slope length and the steepness of the slope. LS factor is affected by the amount of ground cover under the trees, the amount of water that flows across the surface, the soil type and how much rainfall the area receives (in this case, a lot).

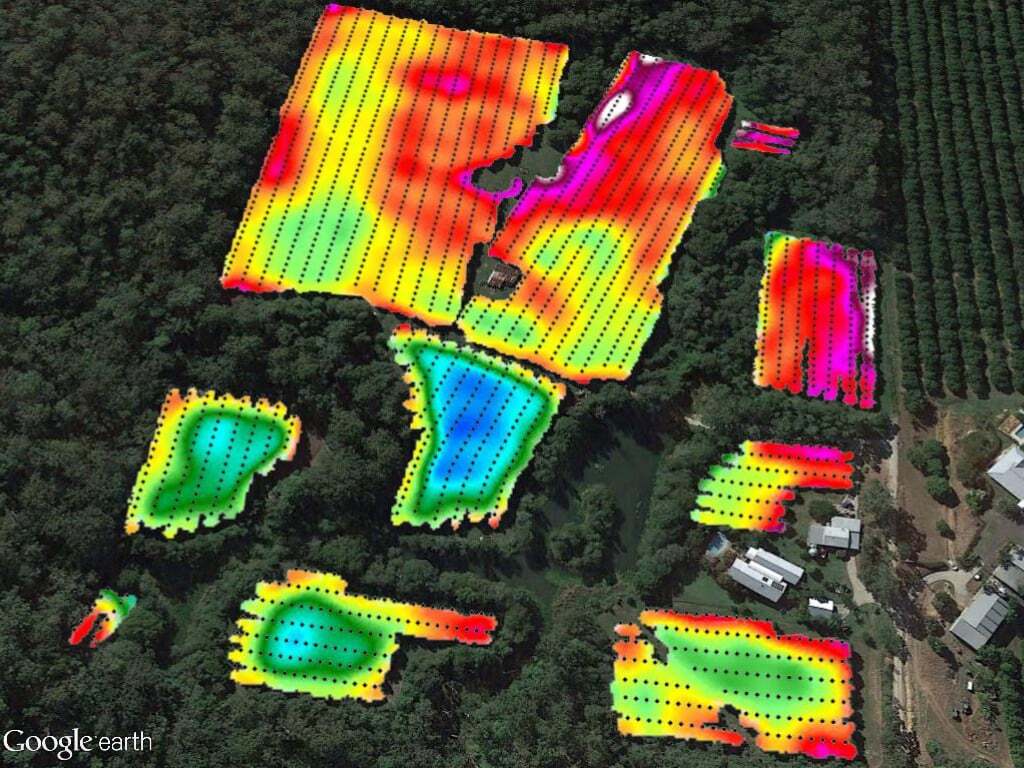
The main factor in maintaining good ground cover beneath the trees to minimise erosion is managing how much sunlight reaches the orchard floor. If the tree canopy shades out the grass cover under the trees and the grass dies off, both nuts and soil get washed away during major rain events. A real lose-lose.

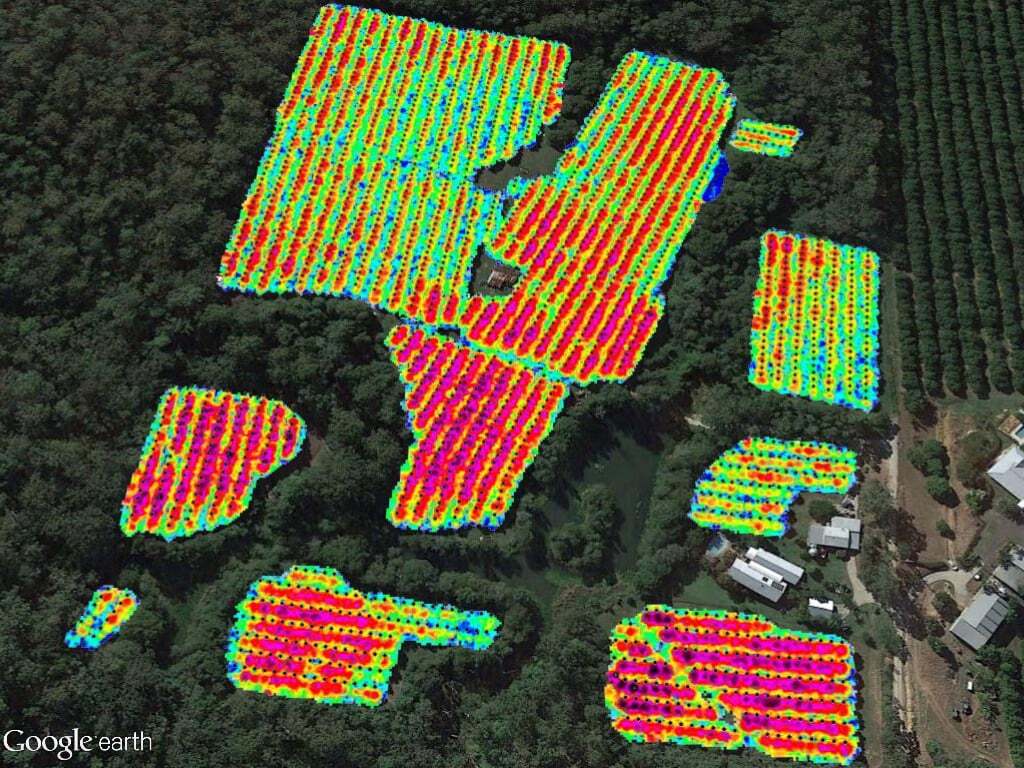
Canopy height and density is a major factor in determining how much sunlight reaches the ground cover below the trees. In some cases, growers may need to be prepared to trim the canopy and even thin out the trees to increase sunlight reaching the ground cover in high LS factor areas.

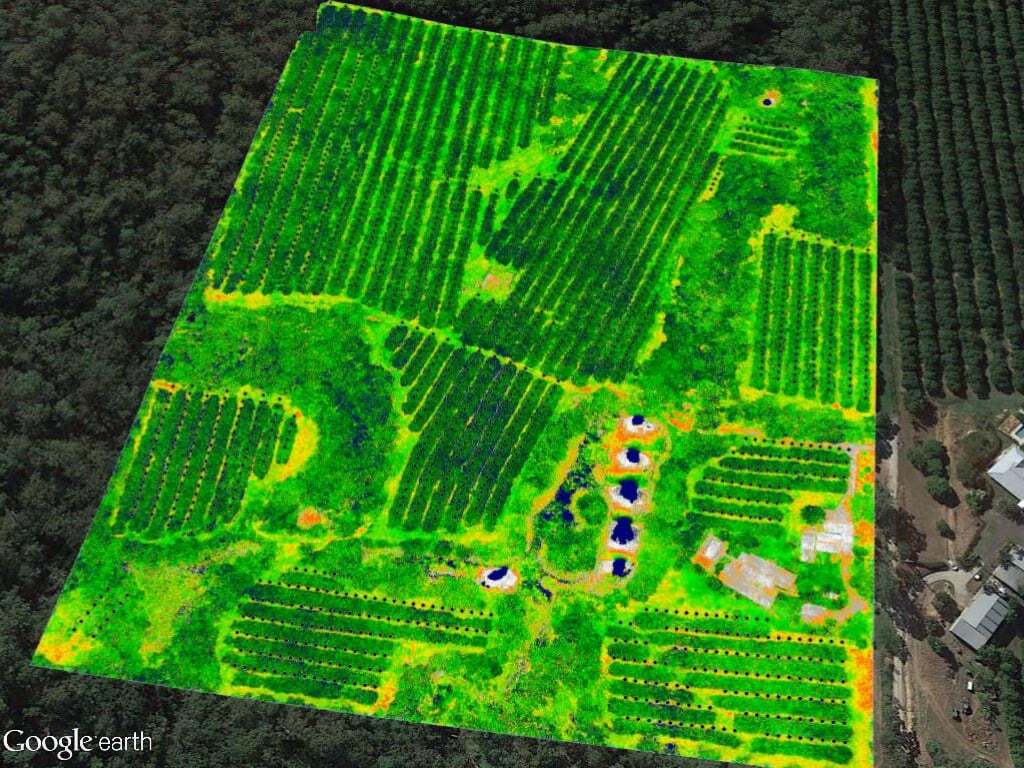
NDVI surveys show the relative health of each tree in the orchard, indicated by the deepness of the green. Areas where ground cover is clearly struggling are shown in orange and yellow. NDVI can’t reach under the trees but does show a correlation between tree canopy height, density and the health of each tree.


NDVI surveys also show a strong correlation between relative tree health and the amount of sunlight reaching the orchard floor. This is thought to be due to erosion leaching nutrients and soil from areas where ground cover is weak due to lack of sunlight penetration to the orchard floor.


Finally, NDVI imagery shows a strong correlation with elevation, thought to be due to soil washing off the higher points down into the lower areas so tree growth is weaker in the highest areas of the orchard and strongest in the lower areas where there is both more water and more nutrition.
Where to from here?
Queensland Drones is continuing to work with the study group growers and a local agronomist to monitor tree health quarterly and identify longitudinal trends over time that may highlight other opportunities to help improve the performance and management of the orchard.
Part of the data provided to growers from the study is recommendations for improvements to orchard canopy cover and drainage to reduce potential for further erosion. We expect to see the impacts of these improvements in improved crop health, measured by ongoing NDVI surveys.
Over the course of 2017 we will also be looking at seasonal variations in tree health across the orchards of the study group to see, for example, how the orchard copes with the increased water demand as trees come into flower for the new fruiting season, and as the fruit grows through to harvest.
Like to join the study?
There are opportunities for more growers to participate in this ground-breaking study and identify similar potential for improvement in their own orchards. The cost of participation is quite low (*less than $2000 initially for EM soil analysis, LIDAR imagery and NDVI imagery, and about $400 per quarter ongoing for longitudinal NDVI surveys) and the potential benefits are very high. Through participation in this study you will learn a lot more about your property and all the factors that affect your crop yield. You will also be able to monitor the impact of implementing suggested improvements over time.
Get in touch with Queensland Drones
To find out how we can help you achieve your aerial photography, aerial video and aerial mapping needs, get in touch with us using the links below.

Leave a Reply
You must be logged in to post a comment.