
Post-Flood LiDAR Mapping of 244 km of Rivers and Creeks for Ipswich City Council
Summary
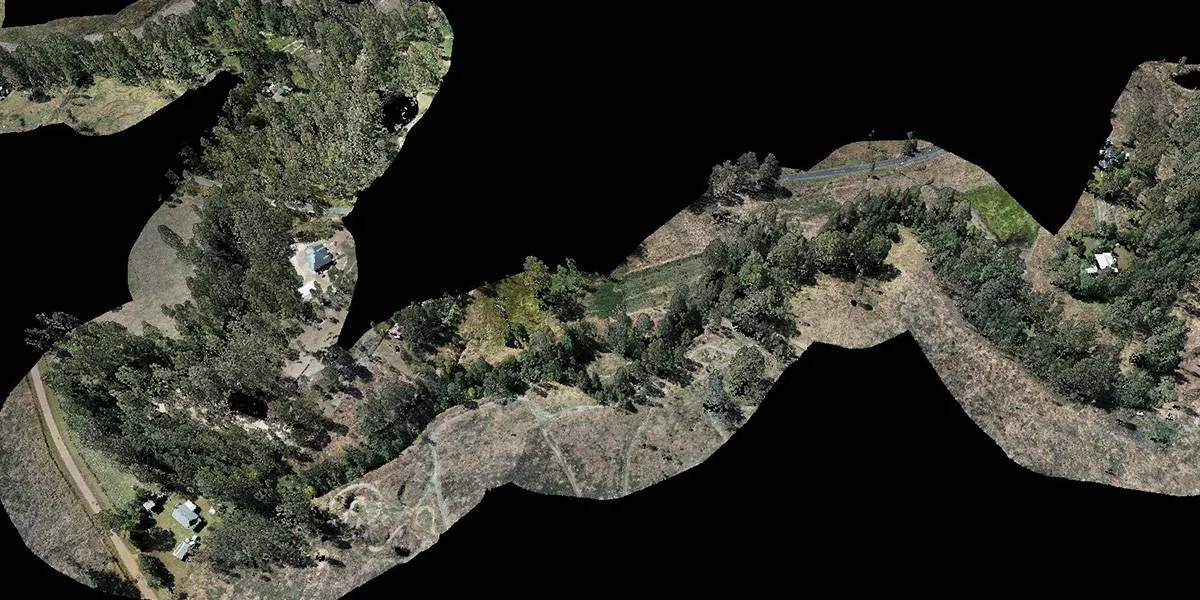
After the 2022 floods, Queensland Drones mapped 244 km of rivers and creeks across the Ipswich local government area for Ipswich City Council using drone LiDAR and photogrammetry.
The data showed council where flood debris and damage needed a response. A follow-up project classified the full point cloud and produced ground-classified DEMs for every waterway, giving council a baseline to measure change after future floods. Part of the work was flown around RAAF Base Amberley, in close cooperation with Amberley tower staff.
| Project fact | Detail |
|---|---|
| Client | Ipswich City Council (won by tender) |
| Purpose | Post-flood debris and damage detection, then a baseline for future flood events |
| Total length mapped | 244 km of rivers and creeks |
| Waterways | Brisbane River, Bremer River, Purga Creek, Woogaroo Creek, Bundamba Creek, Six Mile Creek, Black Snake Creek, Small Creek |
| Capture method | Drone LiDAR and photogrammetry |
| Airspace | Class D controlled airspace including flights around the perimeter of RAAF Base Amberley, coordinated with Amberley tower |
| Phase 1 outputs | 3D colourised point clouds and high-resolution 2D orthomosaics |
| Phase 2 outputs | ASPRS-classified point clouds and ground-classified DEMs for each waterway |
| Capture period | After the 2022 flood event |
The challenge
Council needed to know quickly, and in detail, what the 2022 floods had done to hundreds of kilometres of waterways across the Ipswich region — much of it impossible to inspect safely on foot.
All kinds of debris wash down into rivers and creeks during major floods. Bankd collapse and scoured channels can threaten bridges, roads and properties in the next rain event. Finding them means looking at every reach of every creek.
- Scale. 244 km of rivers and creeks, from the Brisbane and Bremer Rivers to small tributaries like Black Snake Creek and Small Creek.
- Access and safety. After a flood, banks can be unstable, saturated and choked with debris. Walking or boating the waterways after a flood is slow and dangerous.
- Vegetation. Riparian trees, including dense Chinese Elms and scrub, hide the banks from above. A camera-only survey sees the canopy; LiDAR reaches the ground through gaps in it.
- Controlled airspace. Much of the airspace was inside the RAAF Amberley control zone. Some reaches ran directly around RAAF Base Amberley, an active military airbase, so flights there needed close coordination with air traffic control.
Methodology
The project ran in two phases: rapid capture to find flood damage, then full classification to create a permanent baseline.
Phase 1: post-flood capture
- Tender and scoping. We won the work through Ipswich City Council’s tender process and agreed the waterways and corridor widths to be mapped. The agreed corridor width was 50m either side of the river or creek bank.
- Airspace coordination. Reaches near RAAF Base Amberley were planned and flown in close cooperation with Amberley tower staff, including close telephone coordination when the runways were in use.
- Corridor flight planning. Flight lines followed each river and creek channel, covering both banks.
- LiDAR and photogrammetry capture. We captured LiDAR and imagery together along all eight waterways — 244 km in total.
- Processing and delivery. Our GIS team processed the data in-house into 3D colourised point clouds and high-resolution orthomosaics, so council could inspect every reach for debris and damage.
Phase 2: classification and flood baseline
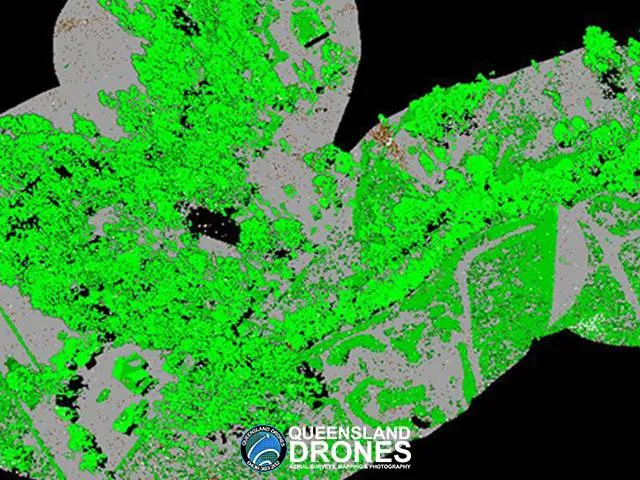
- Point cloud classification. Council then engaged us to classify the full point cloud to ASPRS standard classes, separating ground from vegetation, buildings and other features.
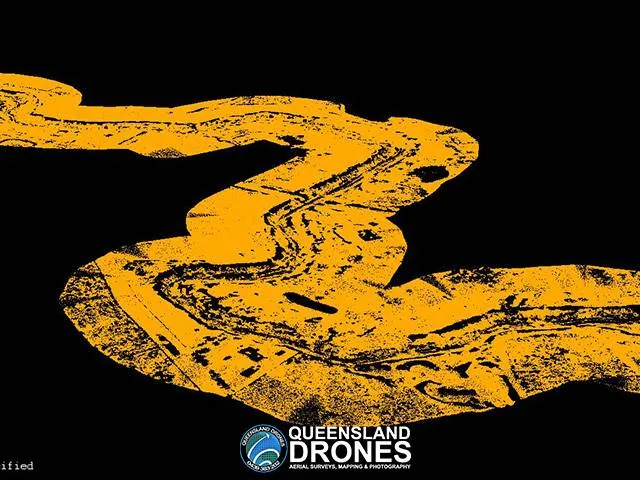
- Ground-classified DEMs. From the ground class we produced a bare-earth DEM for each river and creek, giving council a baseline surface to compare against after future floods.
Deliverables
Council received two sets of deliverables: inspection-ready imagery and point clouds straight after the flood, then classified, analysis-ready terrain models as a long-term baseline.
| Deliverable | Phase | What council uses it for |
|---|---|---|
| 3D colourised point clouds | 1 | Inspecting banks, debris jams and damage in 3D, measuring sizes and heights |
| High-resolution 2D orthomosaics | 1 | Plan-view inspection, mapping debris locations, planning clean-up access |
| ASPRS-classified point clouds | 2 | Separating ground, vegetation and structures for analysis |
| Ground-classified DEM for each waterway | 2 | Bare-earth baseline to compare against after future floods |
Validation and quality control
For a baseline that council will compare future floods against, consistency matters as much as raw accuracy: every waterway was captured and processed the same way.
- In-house processing. All data was processed by our own GIS team, not a cloud platform, so every reach followed the same workflow and checks.
- ASPRS classification. Points were classified to the ASPRS standard classes used across the geospatial industry, so council’s GIS team and future contractors can use the data without re-processing it.
- Consistent ground model. Each DEM was built from the ground class only, with vegetation and structures removed, so later surveys can be compared like for like.
For context, these are our usual drone LiDAR accuracy tiers. Actual results depend on terrain, ground surface and ground cover and dense riparian vegetation is one of the harder cases.
| Ground control used | Typical horizontal accuracy | Typical vertical accuracy |
|---|---|---|
| None | ~5 cm | ~10 cm |
| Sufficient ground control | ~3 cm | ~5 cm |
| Ground control plus checking by a registered surveyor | ~2 cm | ~3 cm |
Client outcome
Ipswich City Council got a complete, current 3D record of 244 km of flood-affected waterways to target debris and damage response, then engaged us on a follow-up project to turn it into a permanent flood baseline. Both phases were built on the same capture, so council paid for the field work once.
- Targeted response: council could see where debris and damage were, rather than inspecting every reach on foot. Debris identified included fallen trees, car bodies, old fridges, debris from collapsed buildings, even old ramps and jetties.
- Safer inspection: crews didn’t need to walk or boat unstable, flood-affected banks to find problems.
- A baseline for the next flood: the ground-classified DEMs let council measure exactly how each waterway changes after future events.
- Data that lasts: ASPRS-classified point clouds and DEMs can be reused by council’s GIS team and future contractors.
Frequently asked questions
Can drone LiDAR map flood damage along rivers and creeks?
Yes. Drone LiDAR and imagery captured along a waterway show debris jams, bank collapses and channel changes in 3D, without crews walking unstable banks. Queensland Drones mapped 244 km of rivers and creeks for Ipswich City Council after the 2022 floods.
Can drone LiDAR see underwater or map a river bed?
Not through water. Standard topographic LiDAR uses near-infrared light, which water absorbs, so the water surface returns little or no data and the bed below it isn’t captured. Banks, bars and dry channel areas are mapped in full, so capture is best timed for low flow. Mapping below water needs bathymetric (green-laser) LiDAR or a boat-based sonar survey.
Why use LiDAR instead of photogrammetry for creek mapping?
Riparian trees and scrub hide the banks from a camera. LiDAR pulses pass through gaps in the canopy and record the ground beneath, which is what flood and erosion analysis needs.
What is a ground-classified DEM and why is it useful after a flood?
It is a bare-earth elevation model built only from LiDAR points classified as ground, with trees, buildings and debris removed. Captured after one flood, it becomes a baseline: a later survey can be compared against it to measure erosion, deposition and channel change.
What does ASPRS-classified mean?
The ASPRS (American Society for Photogrammetry and Remote Sensing) classes are the standard categories used to label LiDAR points — ground, vegetation, buildings, water and so on. Using them means the data works in any standard GIS or CAD software.
Can drones be flown near a military airbase like RAAF Base Amberley?
Only with the right approvals and close coordination with air traffic control. On this project, flights around the perimeter of RAAF Base Amberley were carried out in close cooperation with Amberley tower staff.
How much waterway can a drone LiDAR survey cover?
Far more than many people expect. This project covered 244 km of rivers and creeks across eight waterways. We were able to cover 30-50 km of waterway each day, depending on the channel width.
Need waterways, floodplains or flood damage mapped?
Queensland Drones is a CASA-certified drone survey and LiDAR mapping specialist (ReOC #6466), operating since 2016 across Queensland, New South Wales and the Northern Territory. We map rivers, creeks, catchments and corridors for councils, engineers and environmental managers.
Give Tony a call on 1300 246 977 or request a quote.
Related: 3D LiDAR Model of a Water Catchment · Environmental Mapping and Monitoring · Aerial LiDAR Mapping · Rural Road Corridor Mapping
