
3D LiDAR Model of a 380 ha Water Catchment Rehabilitation Site
Summary
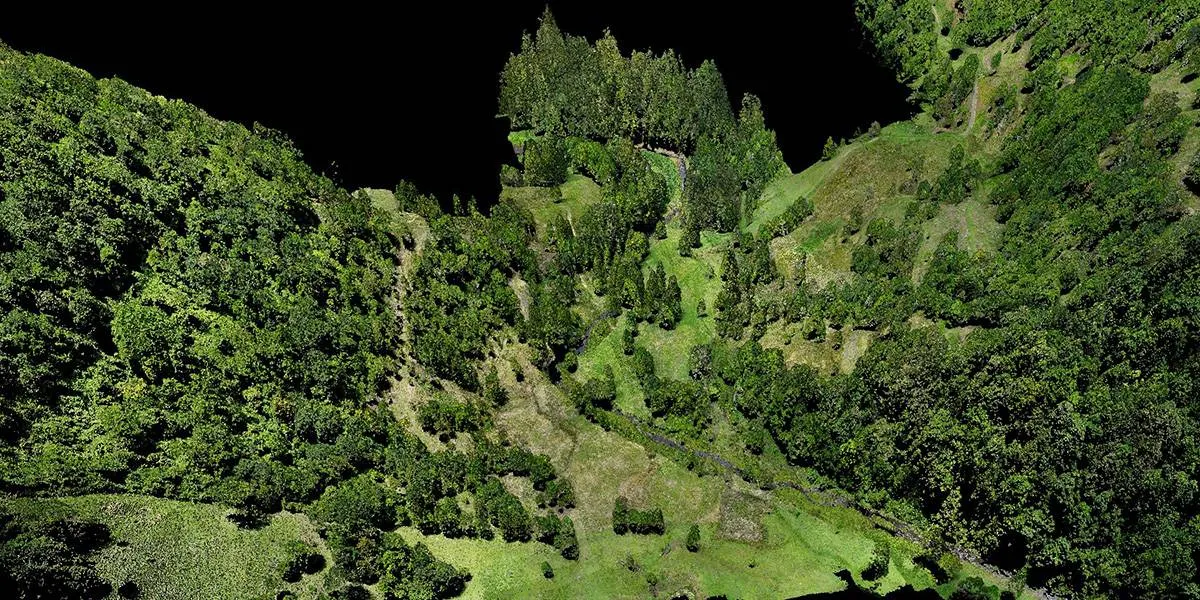
Queensland Drones captured colourised 3D LiDAR of a 380 ha former cattle farm in a major water catchment, so a rehabilitation group working on behalf of Seqwater could model water flows, measure landslips and monitor tree planting from one dataset. We mapped the whole site at medium resolution and two areas of interest at high resolution. The deliverables covered terrain, water and vegetation: point clouds, orthomosaics, a DEM, TIN mesh, contours, profiles, water flow projections, canopy height maps and tree counts.
| Project fact | Detail |
|---|---|
| Client | Water catchment rehabilitation group, on behalf of Seqwater |
| Site | 380 ha former cattle farm in a major water catchment in Maleny region |
| Purpose | Model water flows, measure landslips and monitor tree-planting programs for catchment rehabilitation |
| Capture | Medium-resolution LiDAR of the whole 380 ha, plus high-resolution LiDAR of two specific areas of interest |
| Method | Drone LiDAR with integrated RGB camera |
| Terrain outputs | DEM, TIN mesh, elevation contours, horizontal profiles |
| Water outputs | Water flow projections |
| Vegetation outputs | Canopy height model (CHM) vegetation maps and tree counts |
The challenge
Turning a former cattle farm back into healthy catchment land means knowing exactly where water runs, where slopes are failing and whether new trees are taking hold — across 380 ha of often very steep, partly forested country. In a water supply catchment, erosion and sediment from cleared land can end up in the water supply, so getting rehabilitation right matters.
- Three questions, one site. The group needed to model water flows, measure landslips and track tree planting. Separate surveys for each would cost more and wouldn’t line up with each other.
- Terrain hidden under trees. Much of the site is forest and regrowth along steep slopes and creek lines. A camera-only survey sees the canopy; the true ground surface under it is what drives water flow and slope stability.
- Detail where it matters. Most of the site only needed a broad picture, but a few areas needed much finer detail to monitor a landslip area and new tree planting zones
- Steep, hard-to-walk ground. Landslips and creek gullies are slow and risky to survey on foot.
Methodology
One LiDAR capture answered all three questions using detailed manual ground classification for water flow and landslips, vegetation classification for the tree-planting program and tree counts in targeted replanting areas.
- Two resolutions, one survey. We flew the whole 380 ha at medium resolution for site-wide terrain and water flow, and two areas of interest at high resolution for finer detail.
- LiDAR and RGB together. LiDAR and an integrated mapping camera captured data at the same time, so the point cloud is colourised and lines up exactly with the orthomosaic.
- In-house processing and classification. Our GIS team manually classified the point cloud into ground and vegetation for maximum terrain accuracy. No cloud platforms were involved so the data remained entirely within our control.
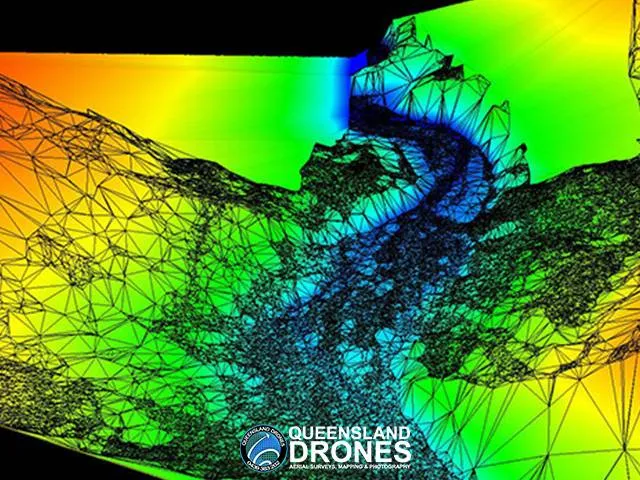
- Terrain and water. The ground points produced a DEM, TIN mesh, elevation contours and horizontal profiles. The DEM drove water flow projections showing where water collects and runs across the site.
- Vegetation. The vegetation points produced a canopy height model (CHM), mapping tree height across the site, and individual tree counts and canopy volume sizes for the planting program.
- Landslips. The high-resolution terrain in the areas of interest let the group measure the landslips in detail with a repeat flight over the landslip area after rehabilitation work was undertaken to detect and measure changes.
Deliverables
The group received nine products from one capture, covering terrain, water and vegetation.
| Deliverable | What it’s used for |
|---|---|
| 3D colourised point clouds | Exploring the site in 3D; measuring slopes, slips and trees |
| High-resolution orthomosaics | Plan-view base map for planning and reporting |
| Digital Elevation Model (DEM) | Bare-earth terrain under the trees, for water flow and slope analysis |
| TIN mesh | Continuous 3D ground surface for modelling and visualisation |
| Elevation contours | Terrain shape for planning works and planting |
| Horizontal profiles | Cross-sections through slopes, gullies and creek lines |
| Water flow projections | Where water runs and collects across the site |
| Canopy height model (CHM) vegetation maps | Tree and vegetation height across the site |
| Tree counts and canopy volumes | Measuring and tracking the tree-planting program |
Validation
For a rehabilitation baseline, the bare-earth model under the trees is the part that has to be right: water flow and slope analysis both depend on it. Extensive ground control was used to ensure multiple flights tied in without gaps or errors.
- Ground under canopy. LiDAR pulses pass through gaps in the canopy and manual classification separates true ground returns from vegetation. That’s what makes a reliable DEM possible on large forested slopes and creek lines.
- Consistent across scales. The medium- and high-resolution captures were processed in the same workflow, using the same base station data and coordinate system, so the detailed areas line up with the site-wide model.
- In-house checks. All classification and modelling was done by our own GIS team.
For context, these are the accuracy tiers we normally quote for drone LiDAR. Actual results depend on terrain, ground surface and how thick the ground cover is, and dense forest on steep slopes is one of the harder cases.
| Ground control used | Typical horizontal accuracy | Typical vertical accuracy |
|---|---|---|
| None | ~5 cm | ~10 cm |
| Sufficient ground control | ~3 cm | ~5 cm |
| Ground control plus checking by a registered surveyor | ~2 cm | ~3 cm |
Client outcome
The rehabilitation group got one consistent 3D record of the whole 380 ha site, with terrain, water flow and vegetation analysis from a single capture.
- One survey, three uses: water flow, landslips and tree planting were all answered from the same LiDAR data, so the results line up with each other.
- Ground truth under the trees: the bare-earth model shows water paths and slope shape that are hidden from the air and slow to walk.
- A baseline for monitoring: tree counts and canopy heights give a starting point to measure planting success over time.
- Detail where it was needed: high resolution only over the two areas of interest kept the survey cost-effective across 380 ha.
Frequently asked questions
How is drone LiDAR used in water catchment rehabilitation?
Drone LiDAR maps the true ground surface and the vegetation on it in one capture. The ground model shows where water flows, collects and causes erosion, and where slopes are slipping. The vegetation layer maps tree height, canopy volume and tree counts, so planting programs can be measured. Queensland Drones used this approach on a 380 ha former cattle farm being rehabilitated in a major water catchment, for a group working on behalf of Seqwater.
Can drone LiDAR count trees?
Yes. Once the point cloud is classified, individual trees can be detected and counted, and a canopy height and volume model (CHM) maps their height across the site. Repeating the survey later shows how planted trees are growing.
What is a canopy height model (CHM)?
A CHM is a map of vegetation height, made by subtracting the bare-earth surface (DEM) from the top-of-canopy surface. It shows where trees are, how tall they are and how cover changes across a site.
Can drone LiDAR measure landslips?
Yes. High-resolution LiDAR captures the shape of a slip — its scarp, extent and displaced ground — in 3D, even under vegetation. Comparing surveys over time shows whether a slip is moving and the extent to which rehabilitation work has been successful.
How does LiDAR help model water flow on a property?
Water flow depends on the true ground surface, which trees and grass hide from RGB cameras. LiDAR’s ground-classified DEM shows the real terrain, so flow paths, ponding areas and catchment boundaries can be modelled accurately.
Why map some areas at higher resolution than others?
It keeps large surveys cost-effective. On this project the whole 380 ha was mapped at medium resolution for site-wide analysis, with high resolution only over two areas of interest that needed finer detail.
Planning a catchment, rehabilitation or environmental survey?
Queensland Drones is a CASA-certified drone survey and LiDAR mapping specialist (ReOC #6466). We have operated since 2016 across Queensland, New South Wales and the Northern Territory. We map catchments, waterways and rehabilitation sites for water authorities, landcare and rehabilitation groups, and environmental managers.
Give Tony a call on 1300 246 977 or request a quote.
Related: Post-Flood LiDAR Mapping of 244 km of Rivers and Creeks · Environmental Mapping and Monitoring · Aerial LiDAR Mapping · Precision Farm Mapping
